
Pinterest Analytics: A Beginner’s Guide to Measuring What Matters
 Revive.Social Editorial
 Pinterest Analytics helps you answer practical questions about your own content: which Pins appear on screen, which ones people save, and which ones prompt outbound click actions. The useful part is not collecting every number. It is matching one metric to one business question and using the result to plan a small test.
You will generally need an eligible business account to use the current Pinterest reporting surfaces. Claiming your website can also help connect Pins from your domain with the account. 📌 Labels, metrics, and availability can vary by account or region, so check the live interface before documenting a team workflow.
This beginner guide explains the main metrics, Pinterest Trends, site-side validation, and a repeatable weekly or monthly review.
What Pinterest Analytics helps you answer
Begin with a decision, not a dashboard. If you want to know whether an image earns attention, compare Pin-level visibility and engagement measures. If you want qualified site visits, focus on outbound clicks and confirm them in your web analytics. If you want sales or leads, use your site’s conversion tracking rather than treating a Pinterest interaction as the final outcome.
The official Pinterest Analytics documentation is the current reference for the metrics and filters available to your account.[1] Common measures can include the following, but the exact set can change:
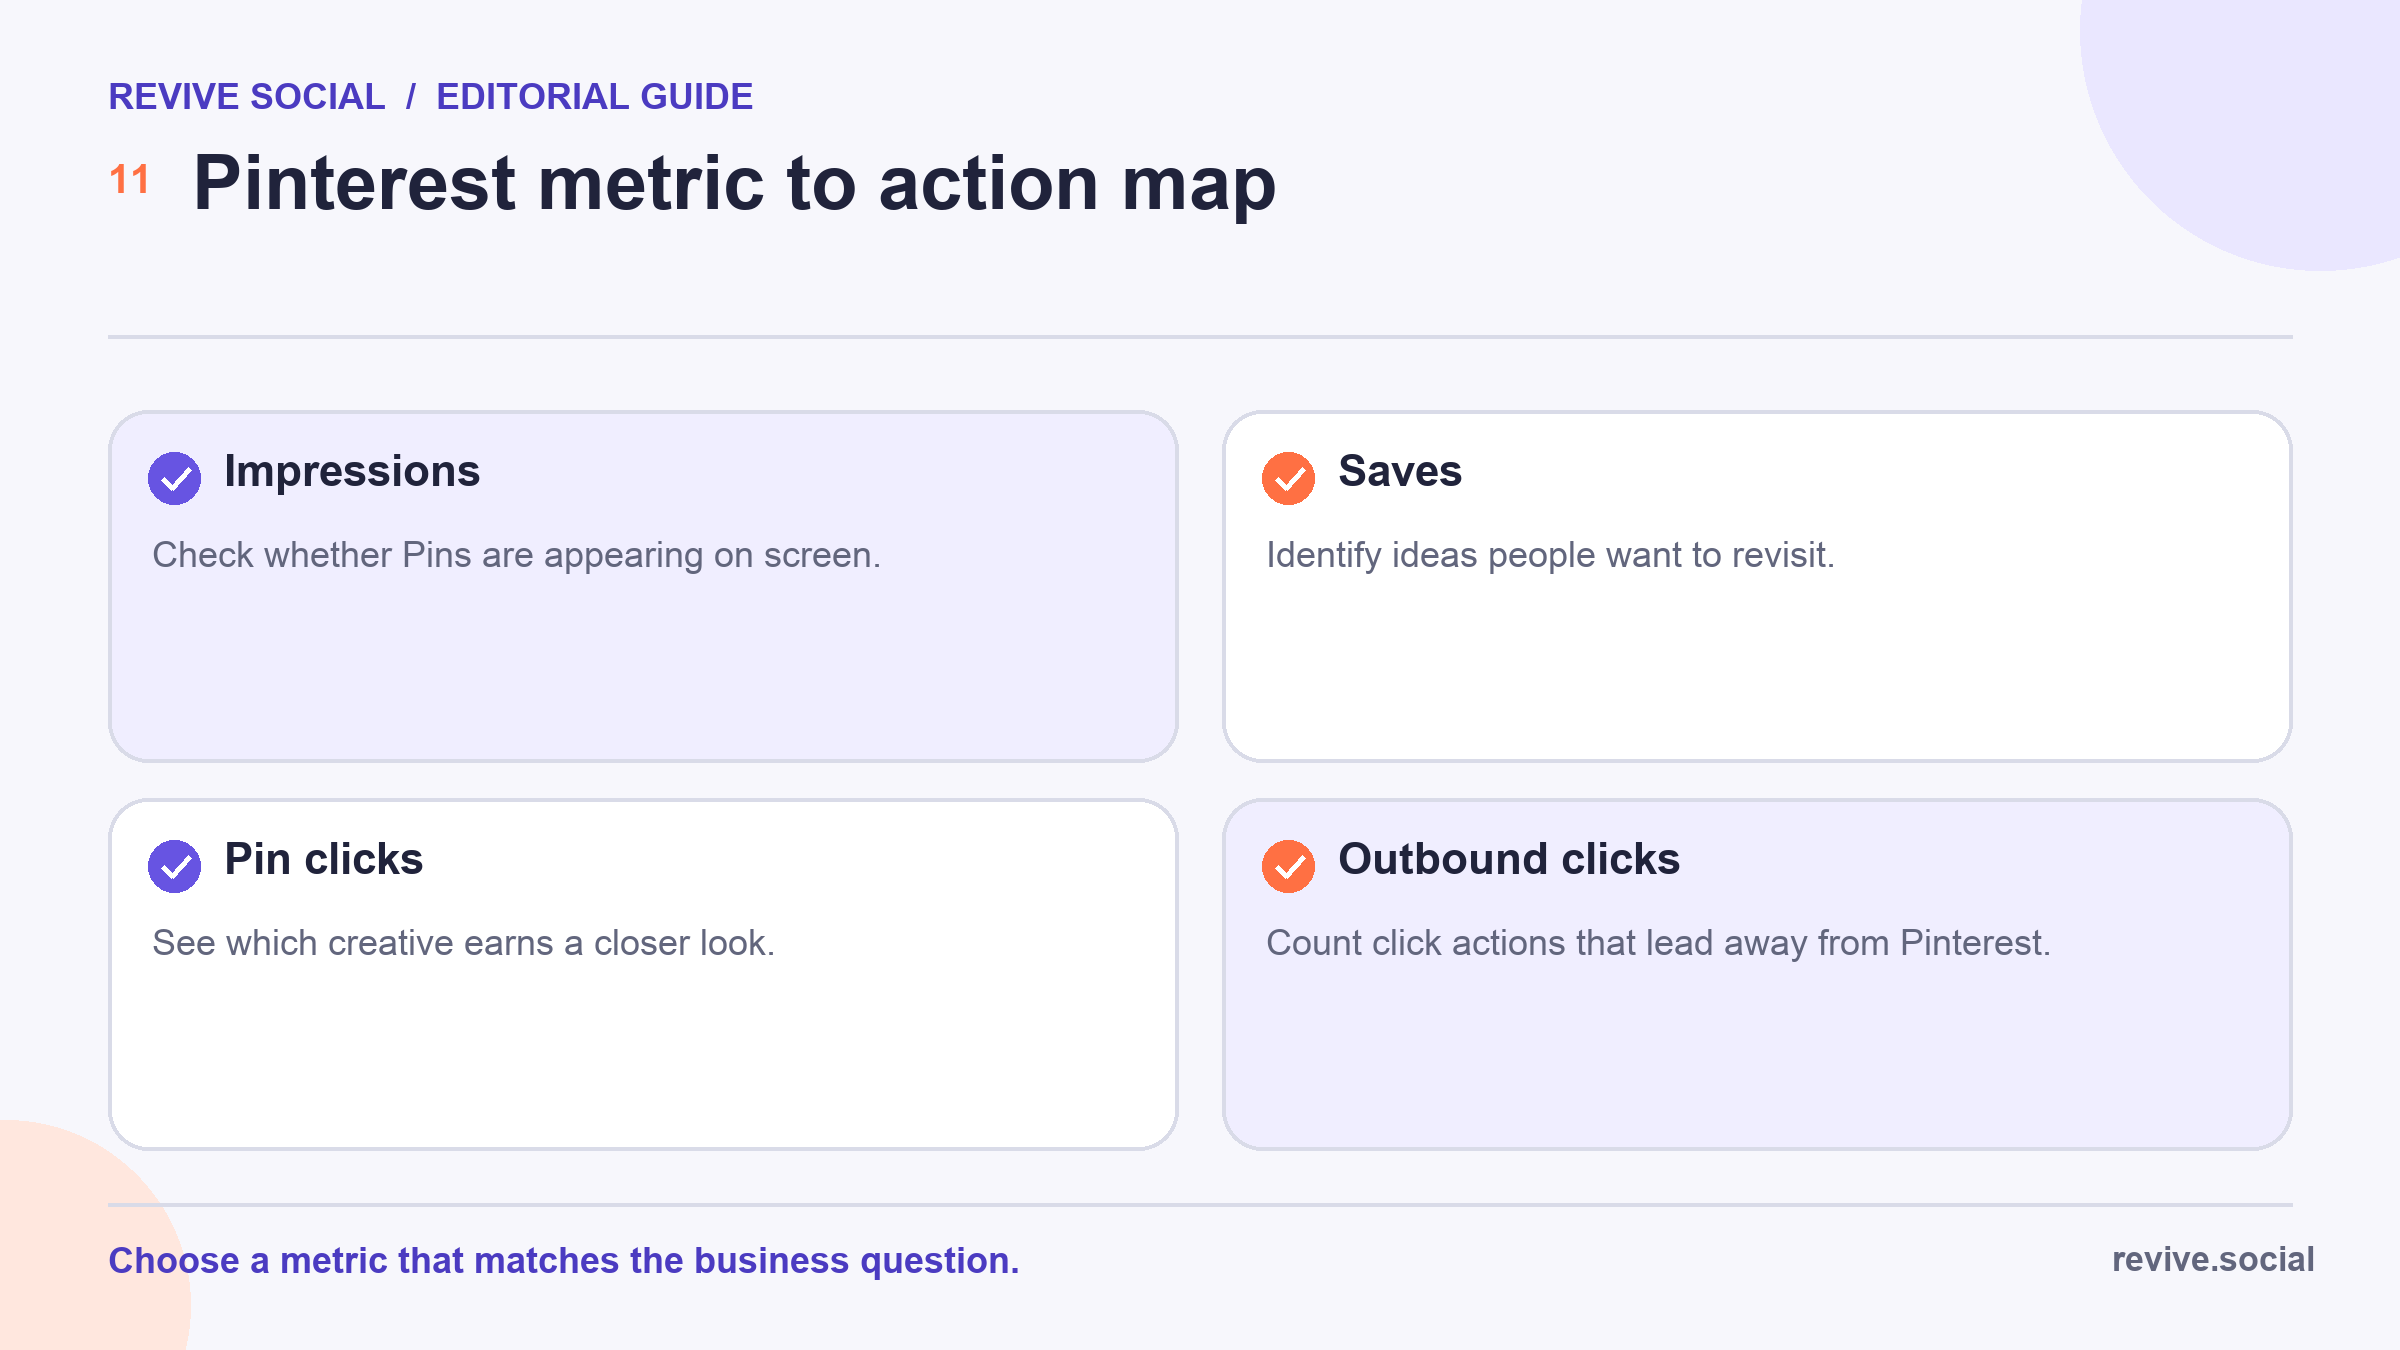
- Impressions: how often your Pins appeared on screen.
- Engagements: interactions with a Pin, which can combine several actions.
- Saves: times people saved a Pin to revisit or organize it.
- Pin clicks: clicks that open a closer view of the Pin.
- Outbound clicks: click actions that lead away from Pinterest to a destination.
Conversions are separate site or campaign outcomes measured through an appropriate tracking setup. Confirm them in the destination system instead of treating an outbound click as a completed visit, lead, or sale.
No single measure means “success” for every account. A recipe publisher and a local service business may value different actions. 🎯 Write the intended outcome beside the metric before you start comparing Pins.
Set up the account and claimed website
Confirm that you are using the correct business account and that the people reviewing performance have appropriate access. Then claim the website you control by following Pinterest’s current verification options. The official claimed-website guide explains the available methods and supported site requirements.[2]
Claiming a site is not a substitute for web analytics. Install and test your site-side measurement separately. Add consistent UTM parameters to campaign links when appropriate, then click a test Pin link and confirm that the visit appears with the expected source and campaign values. 🧪
- Confirm the business account and team access.
- Claim only a website your organization controls.
- Verify that Pinterest identifies the claimed domain as expected.
- Test destination URLs and UTM values.
- Document the setup date and the person responsible for maintenance.
If a domain claim fails, do not repeatedly change production-site files without a record. Check the supported methods, caching, redirects, and account ownership first. Ask the site administrator to review any verification code before it is deployed.
Create a measurement dictionary for the team before the first review. For each reported metric, record the label shown in the account, the practical question it answers, the filters used, and the destination report. This prevents “clicks” from quietly meaning Pin clicks in one meeting and outbound clicks in the next. 📚
Also define the site-side source of truth for business outcomes. A lead form, purchase system, or appointment tool may count results differently from the social dashboard. Document the conversion definition, attribution window, consent behavior, and known gaps instead of trying to make unlike totals match perfectly.
Run a short tracking audit after major site, redirect, consent, or analytics changes. Open a test Pin destination, verify the final URL, confirm the page loads on a phone, and check that the expected campaign values arrive in the web report. 🧰 A beautiful dashboard cannot repair a broken destination or lost UTM parameter.
Restrict analytics access to people who need it, and share aggregate observations rather than exporting unnecessary audience detail. The goal is to improve content decisions, not to build profiles of individual users from limited reporting signals.
Archive a screenshot or export only when it supports a documented review, and label it with the account, date range, filters, and capture date. 📁 A graph without those details cannot be reproduced reliably and may be mistaken for a different reporting view later.
Read the current overview metrics
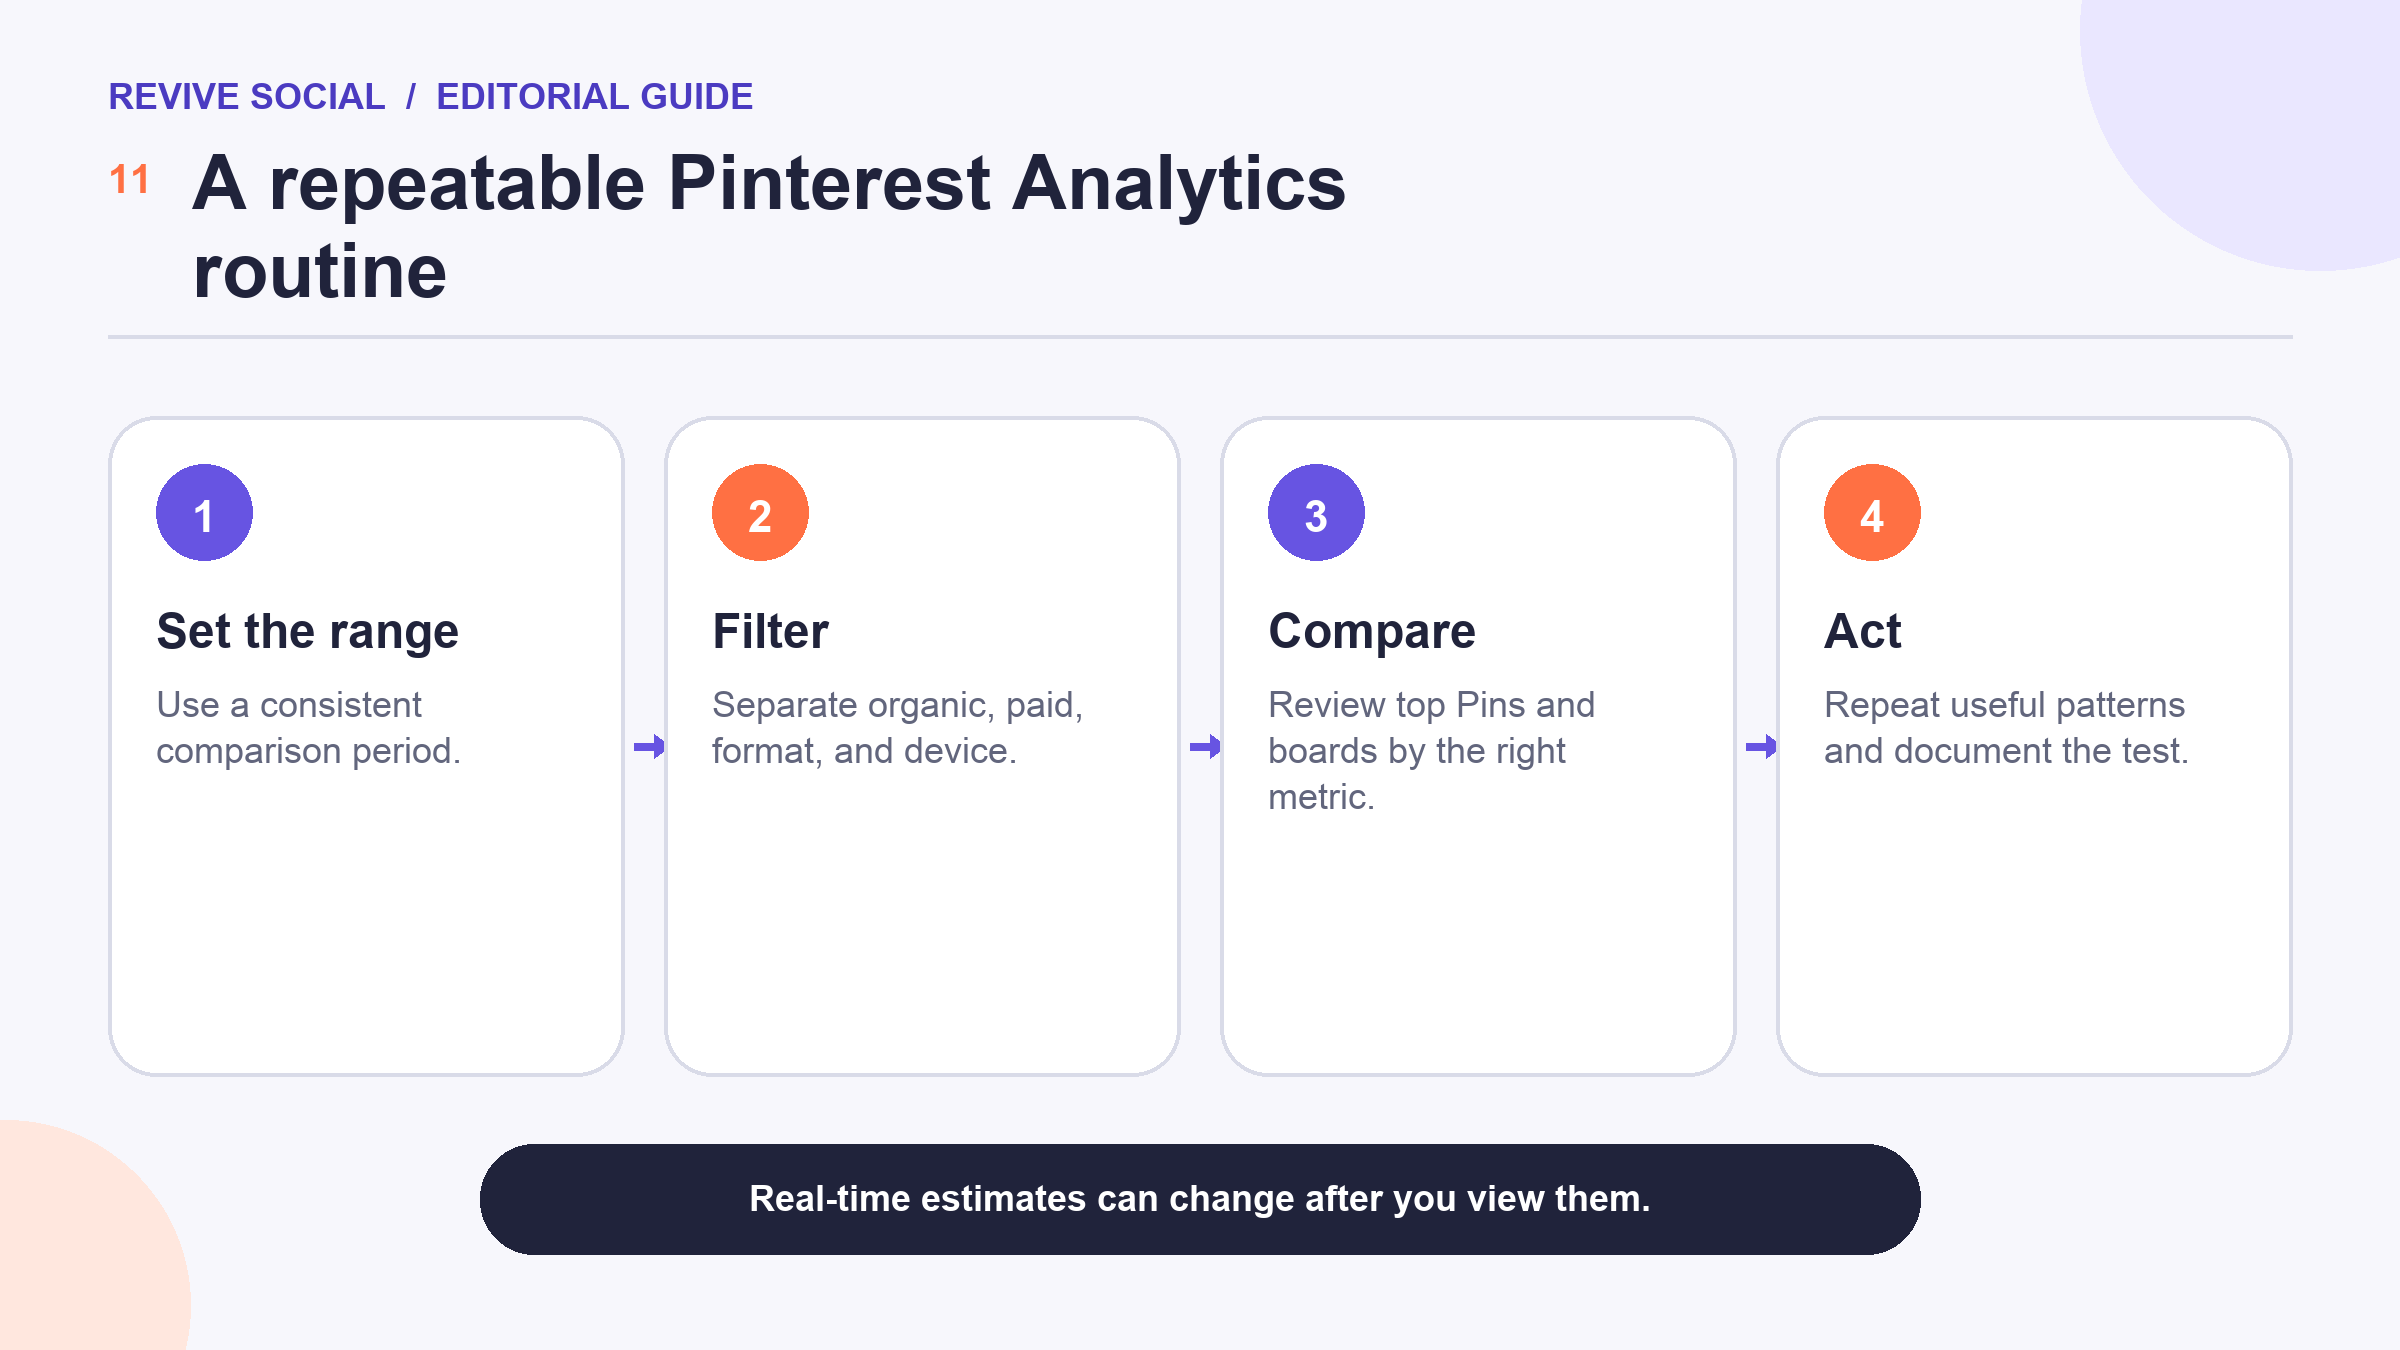
Open the Analytics overview available to your account and set a consistent date range. Before drawing a conclusion, note whether the report includes organic content, paid content, or both. Check filters for content type, device, source, and claimed accounts when they are present. 🔍
Compare like with like. A seven-day launch period should not be compared directly with a full month without normalization. Seasonal topics can also create large changes that have little to do with a new design. Keep the prior period, publishing cadence, and major campaign changes visible in your notes.
| Observation | Possible question | What to check next |
|---|---|---|
| Impressions rise, outbound clicks stay flat | Does the creative set the right expectation? | Destination match, title, image, audience context |
| Saves rise on one topic | Do people want more evergreen examples? | Related Pins, later clicks, seasonal demand |
| Outbound clicks rise, site sessions do not | Is tracking or the destination broken? | URL, redirect, UTM, web analytics |
| One Pin dominates | Is the pattern reusable? | Topic, design, age, distribution source |
Real-time or recent estimates may settle after you first view them. Avoid announcing a winner from a tiny window, and do not assume that an increase in one metric caused a later business result.
Use Pinterest Trends and audience context
Pinterest Trends can help you explore how interest in search terms changes over time and compare related terms where the tool is available.[3] Use it to plan timing and phrasing, not to claim guaranteed demand or platform-wide behavior.
Look for repeatable seasonal patterns, adjacent terms, and differences between the audience context offered by the tool. Then compare those patterns with your own performance. A topic can be broadly popular yet poorly matched to your products, geography, or editorial expertise. 🌱
Handle audience information as aggregated planning context. Do not use it to infer sensitive traits about individual people. If a segment is small enough that reporting could expose or stereotype individuals, step back to a broader, useful category.
Connect metrics to content decisions
Turn an observation into a hypothesis that can fail. “Vertical tutorial Pins with a concrete outcome may earn more outbound clicks than abstract quotes for this audience” is testable. “Pinterest likes tutorials” is too broad to guide a clean experiment. 💡
- Observation: state what changed, for which content, and over what period.
- Hypothesis: name the specific element that may explain the pattern.
- Small test: change one meaningful variable while keeping the comparison reasonable.
- Measure: choose the metric before publishing.
- Decision: keep, revise, or reject the idea after the review window.
Creative changes should be easy to distinguish. If you change the image, topic, description, destination, and publishing time at once, you will not know which difference mattered. For test ideas focused on the asset itself, see the guide to optimizing Pinterest images.
Run a simple weekly or monthly review
Choose a cadence that matches publishing volume. A busy account may need a light weekly check and a deeper monthly review. A smaller account may learn more from one consistent monthly session than from reacting to daily noise. 🗓️
| Observation | Hypothesis | Small test | Next review |
|---|---|---|---|
| Checklist Pins earn more saves | The audience values reusable references | Publish two comparable checklist Pins | After a consistent four-week window |
| One topic earns site visits | The destination matches a high-intent question | Create one adjacent Pin for the same guide | At the next monthly review |
Keep a compact change log: publishing volume, creative tests, campaign periods, tracking changes, site outages, and notable seasonal events. This context prevents a later reviewer from treating every graph movement as a content effect.
Common interpretation mistakes
- Calling impressions visits: an on-screen appearance is not an outbound click.
- Calling saves purchases: future interest does not prove a transaction.
- Mixing date ranges: unequal periods can make a normal change look dramatic.
- Ignoring paid distribution: a promoted Pin should not be treated as a purely organic result.
- Skipping site validation: Pinterest clicks and web sessions can diverge because of redirects, consent, or tracking.
- Assuming causation: a correlated change can have several explanations.
For a cross-channel framework, continue with the guide to tracking social media analytics. When the measurement points to a content gap, use these Pinterest marketing strategies as hypotheses to test, not guaranteed outcomes. 🚦
A reliable Pinterest Analytics habit is deliberately modest: ask one clear question, use the right metric, confirm the site-side outcome, and make one change you can evaluate.
Keep the final review note short: what changed, what remains uncertain, what test begins next, and who owns it. This turns the dashboard into a decision record instead of a recurring presentation with no action.
References
- [1] Pinterest Help: Pinterest Analytics
- [2] Pinterest Help: Claim your website
- [3] Pinterest Help: Pinterest Trends

